
LiDAR Imagery - It’s a Beautiful World

LiDAR Technology
The survey is enabled with LiDAR remote sensing technology, which is a "3D" dataset. The raw data included all the "noise" above the topography such as trees, vegetation, buildings and bridges. Processing the LiDAR to remove all but the "Bare Earth" data allows the production of High Resolution Digital Elevation Models (HRTMs). The HRTMs can have spectacular fidelity, often being able to discriminate elevation changes of only a few tens of centimeters, with spatial resolution measured in 10 cm to 3 square meter grids. Most of the HRTMs used in the Carolina Bay Survey are of 1.2 or 1.5 m resolutions. For a great overview of the technology, you might start with this discussion from GISGeography. The folks at the National Ecological Observatory Network (www.neoninc.org) developed a series of animated video discussing the technology: The Science of Measuring Ecosystems: NEON Education
The LiDAR imagery of Carolina bays has been recognized in the “art & science” community. Interlia Magazine has published several of the images in their Emerging Ideas topic, which can be viewed on line at the link. SciArt Magazine ran an on-line exhibit of this work in their April, 2018 edition, viewable HERE is the table of contents, but the actual article is behind a pay wall.
Examples of LiDAR imagery of the Carolina bays
This page contains numerous examples of LiDAR imagery created for our survey. The SOAR.Earth web resource is hosting many of my newest HRTM images, and it fills the gap left by the loss of Google Earth's embedded viewer. The elevation data presented there is generated using the newer 10 meter cyclic color translation table.
Carolina bays Near Rex, NC
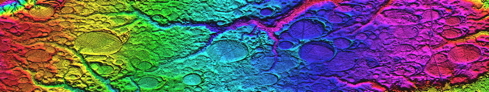
This Digital Elevation Map below covers ~ 1,600 square km centered on Rex, NC (Robeson County), and was generated in the Global Mapper GIS program using LiDAR data from the USGS. The colors shown are an indication of topographic elevation, from 16 m AMSL in the lower right, to 76 m in upper left. Vertical resolutions of centimeters allow for visualization of the form and extent of the bays’ otherwise imperceptible rims. Rockfish Creek flows along the northern edge. CSX’s Atlantic Coast Line rail bisects the area diagonally along a strikingly straight right-of-way; Interstate 95 winds N-S on the right. The HRTM image is available for visualization in the SOAR.earth Internet resource HERE. This imaged region (using a different color palette) was awarded First Place, Abstract Images, at the GSA 2010 Fall Meeting’s Photo Contest & Exhibition. The image is also used in the GSA 2012 Wall Calendar, as the graphic for the month of November.

The SOAR.Earth web resource is hosting many of my HRTM images, and it fills the gap left by the loss of Google Earth's embedded viewer. The above elevation data is regenerated at this LINK using the newer 10 meter cyclic color translation table. The use of the SOAR technology provides the ability to zoom into the details of these landforms at 1 meter per pixel.
Heart of the Carolina bays
The image below is from immediately west of the image above. The image was edited to change the hue of the heart-shaped bay, but not its shape. The HRTM to visualize this area in the SOAR-earth resource is available HERE. A high resolution raster image version is available HERE.

Heart of the Carolina bays on The Ridge

This High Resolution Topographic Model demonstrates the string of basins scattered along "The Ridge" from Augusta, GA to Columbias, SC. This geological ridge is the largest remaining segment of the ancient Cretaceous sedimentary terrace that once blanketed the entire Eastern Seaboard. The original extent of these basins, considering they were formed 800,000 years ago when "The Ridge" was wider than it is today, have been slowly lost to erosion as the terrace has been attacked by the erosion from the Savannah and Edisto drainage systems surrounding the remnant. The imagery reveals a progression of that erosion along the current perimeter of the terrace. A presentation using the SOAR.earth platform is available HERE, and a very high resolution raster image is available HERE.

Geological Research by Cintos is licensed under a Creative Commons Attribution-NonCommercial-ShareAlike 3.0 Unported License.
Based on a work at Cintos.org.
Permissions beyond the scope of this license may be available at http://cintos.org/about.html.